


Story Map
Explore the water quality narrative through an interactive geographic story
Description
Stations (0)
Key Performance Indicators
Sewage Infrastructure
Critical Status - Calculated Indices
Loading data...
Water Quality Analysis
Temporal Variation - DO
Groundwater Depth Analysis
Annual Rainfall Analysis
GroundWater Area Analysis
Pollution Inventory
Varanasi Point Water Level
Potential Pollution Sources
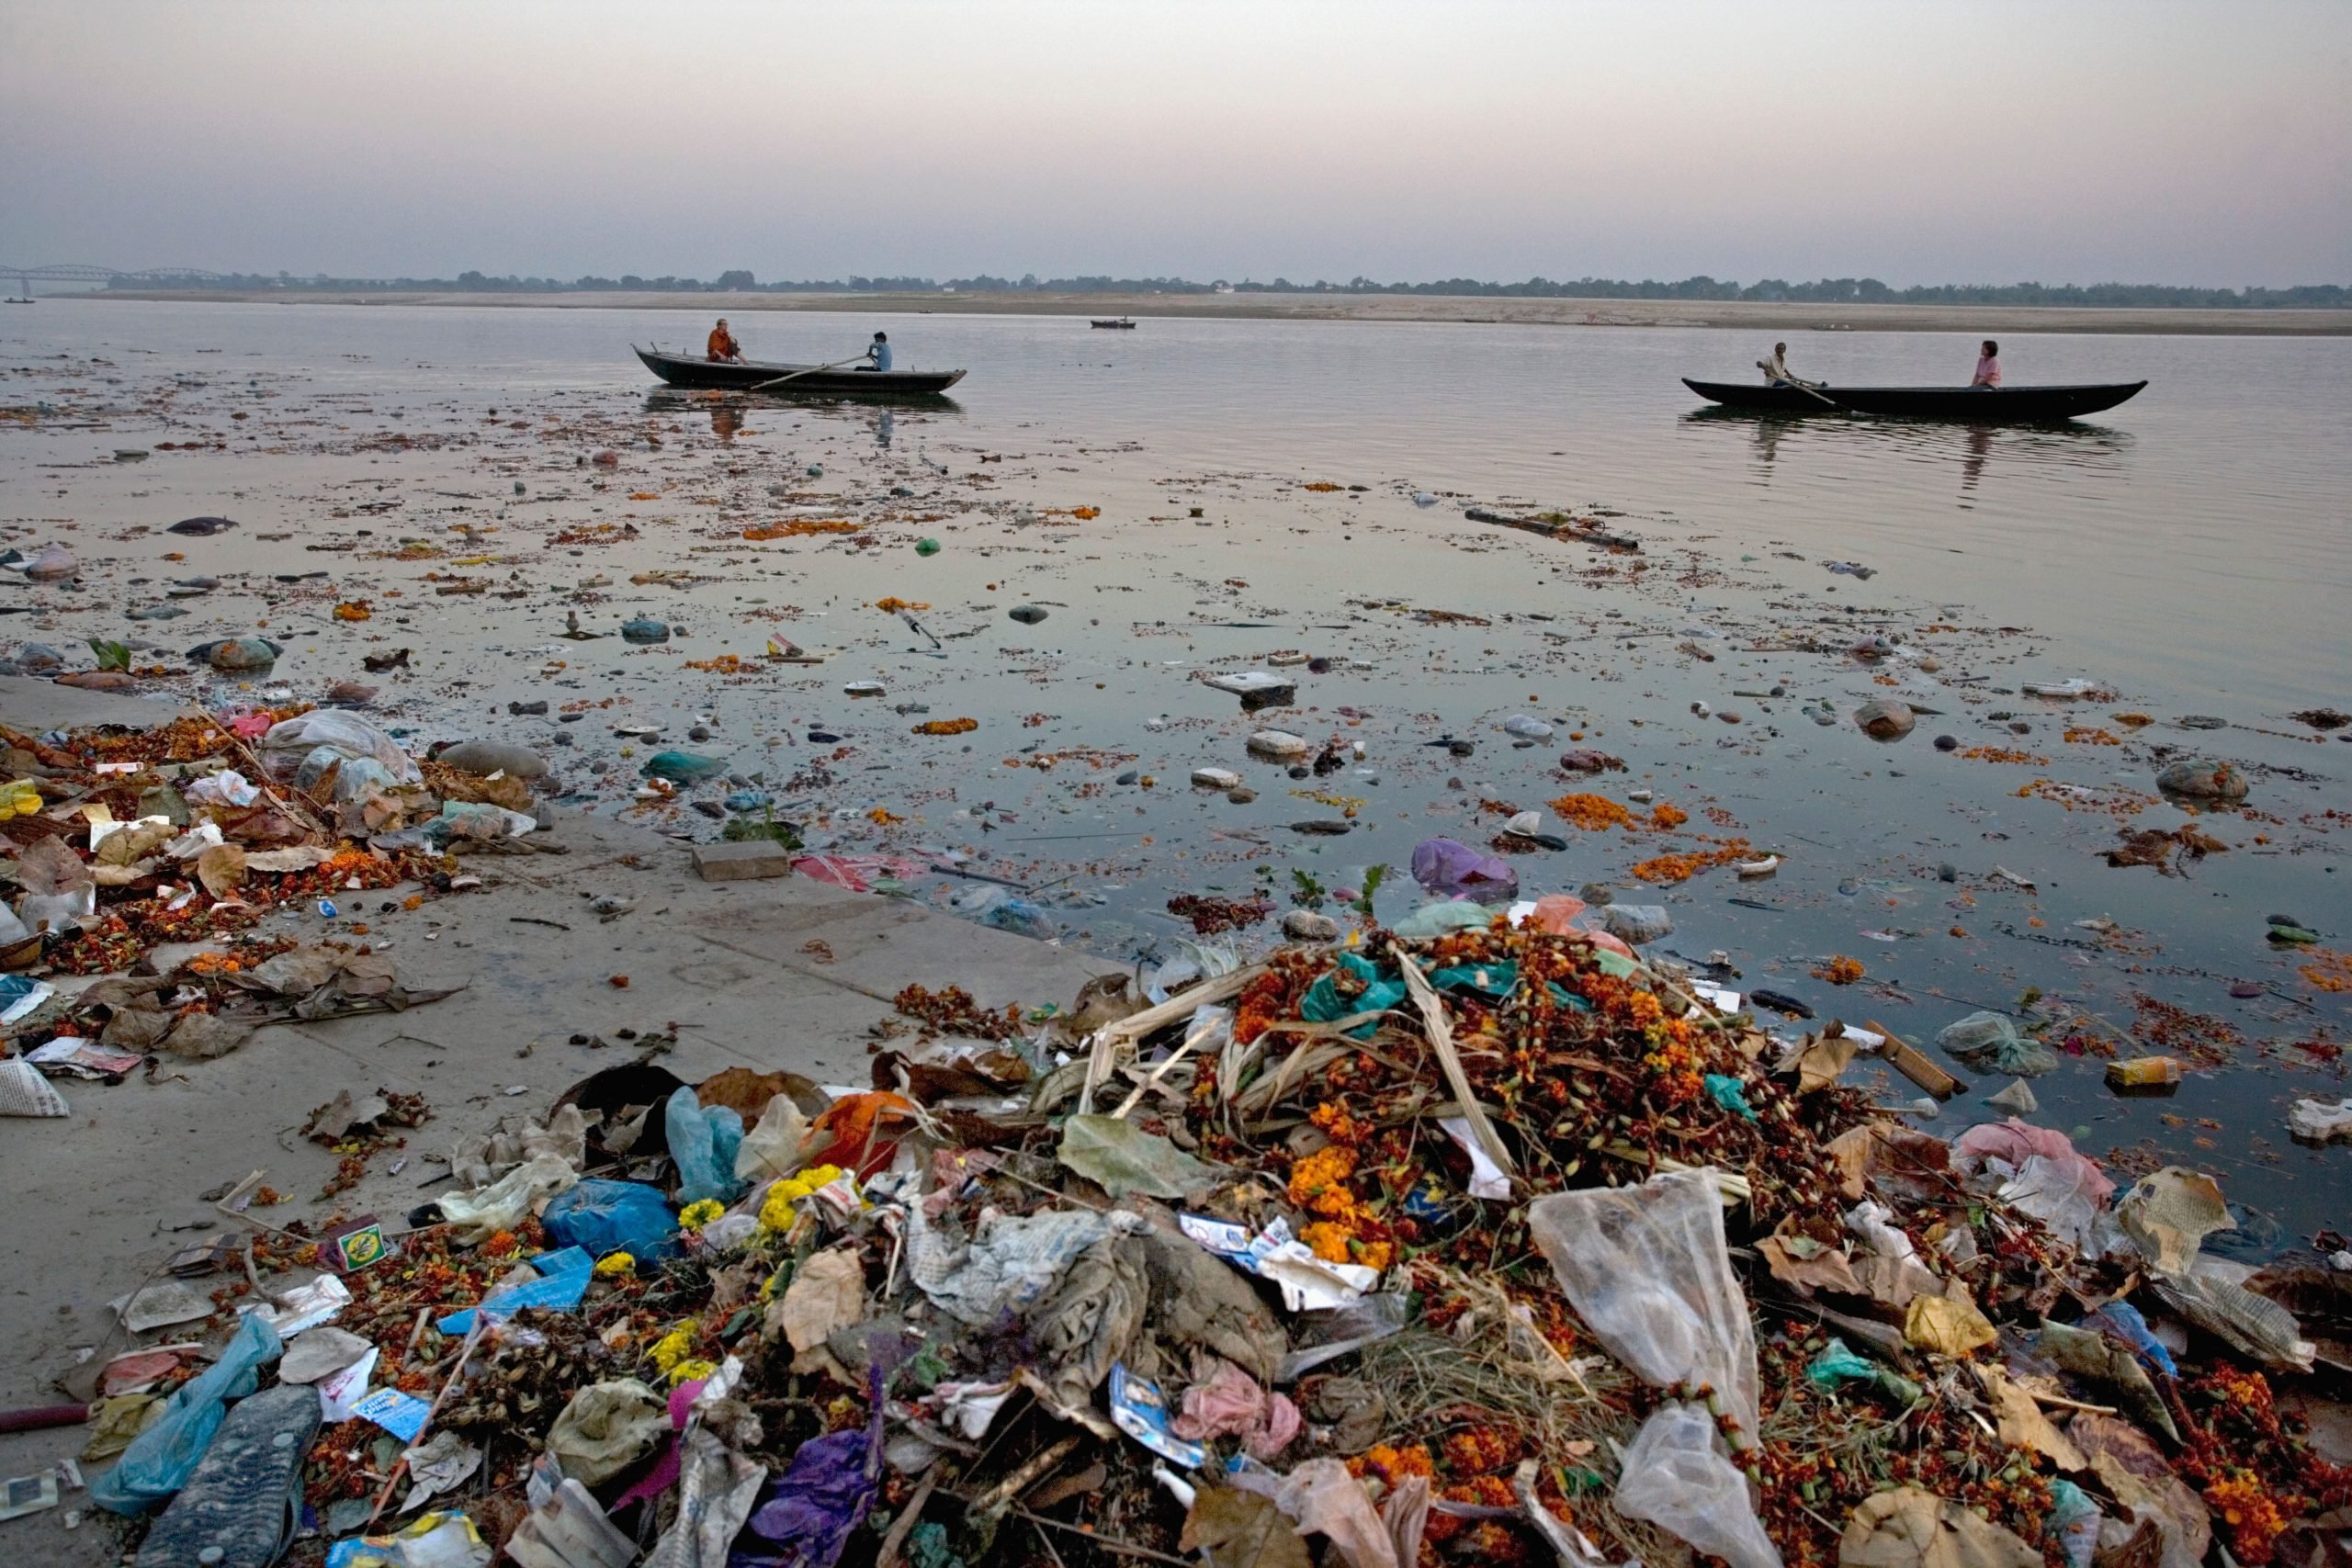
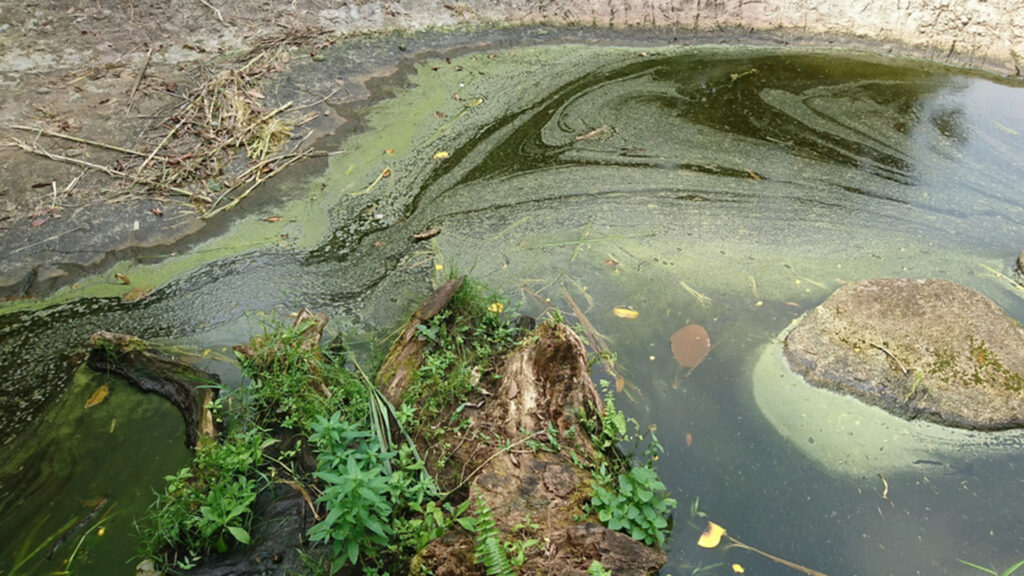
Organic Pollution
High organic load from untreated sewage. Promotes microbial growth, reduces dissolved oxygen.
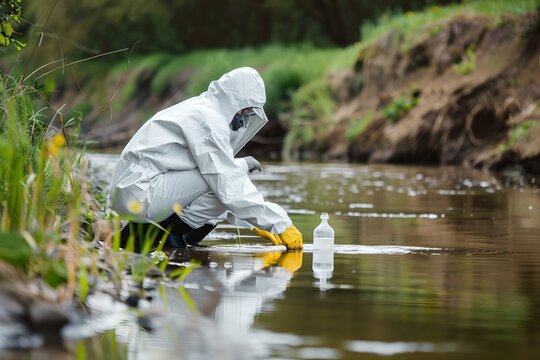
Pathogen Risk
High faecal contamination from untreated sewage poses serious health hazards.

Chemical Pollution
Chemical residues, fertilizers, oils alter water chemistry and harm aquatic life.
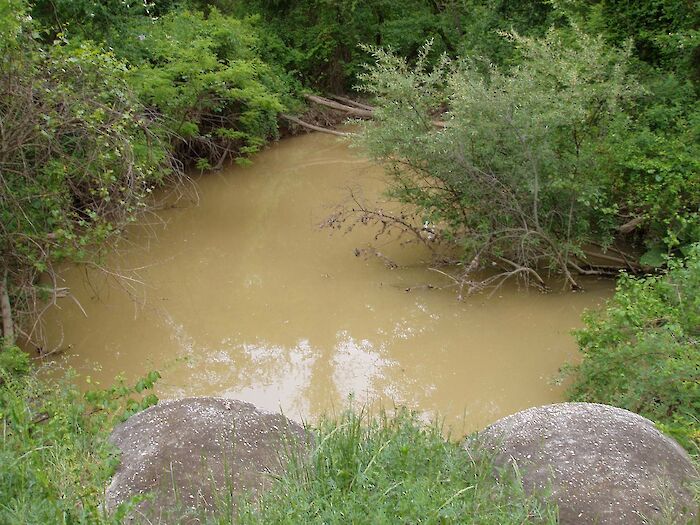
Turbidity
Suspended solids reduce light penetration and disrupt photosynthesis.
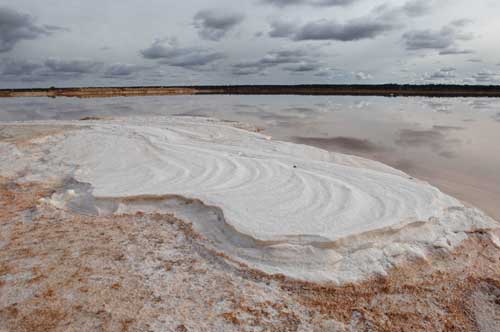
Salinity
Excess salts from sewage affect water quality and aquatic ecosystems.
Nitrates
Nutrient overload from agriculture promotes algal blooms.
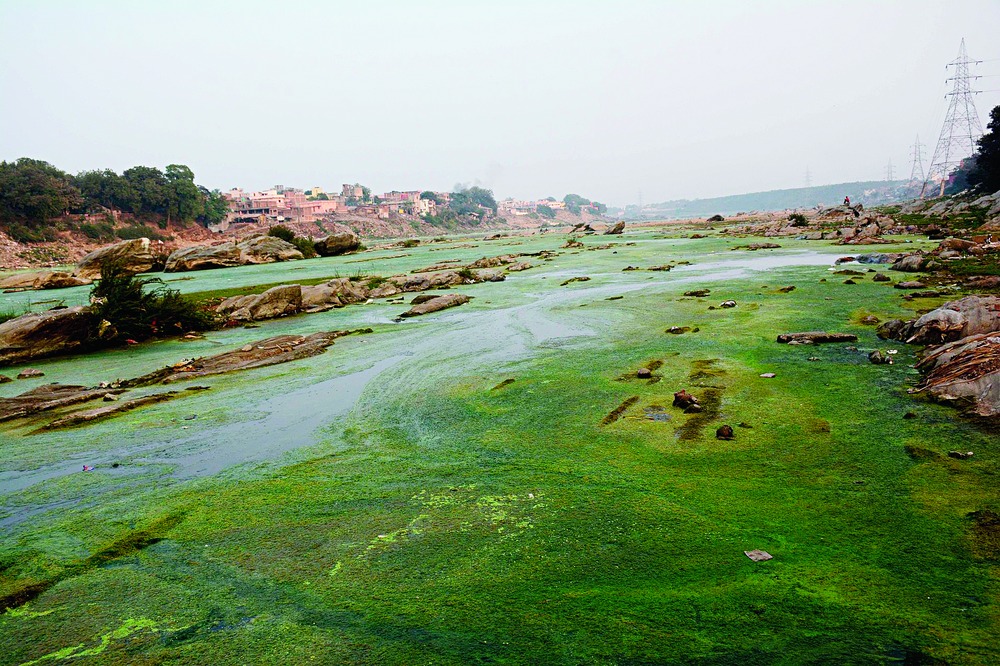
Algae Growth
Excess nutrients cause oxygen depletion and aquatic death.
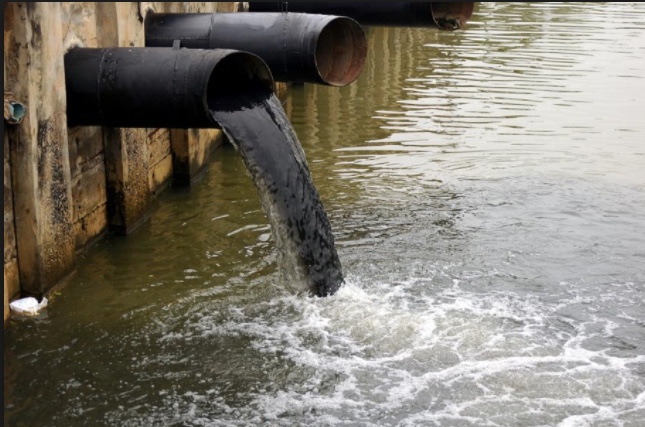
Industrial Contaminants
Toxic discharge bioaccumulates in fish, poses long-term health risks.

Detergents
Greywater with detergents promotes algal growth and eutrophication.
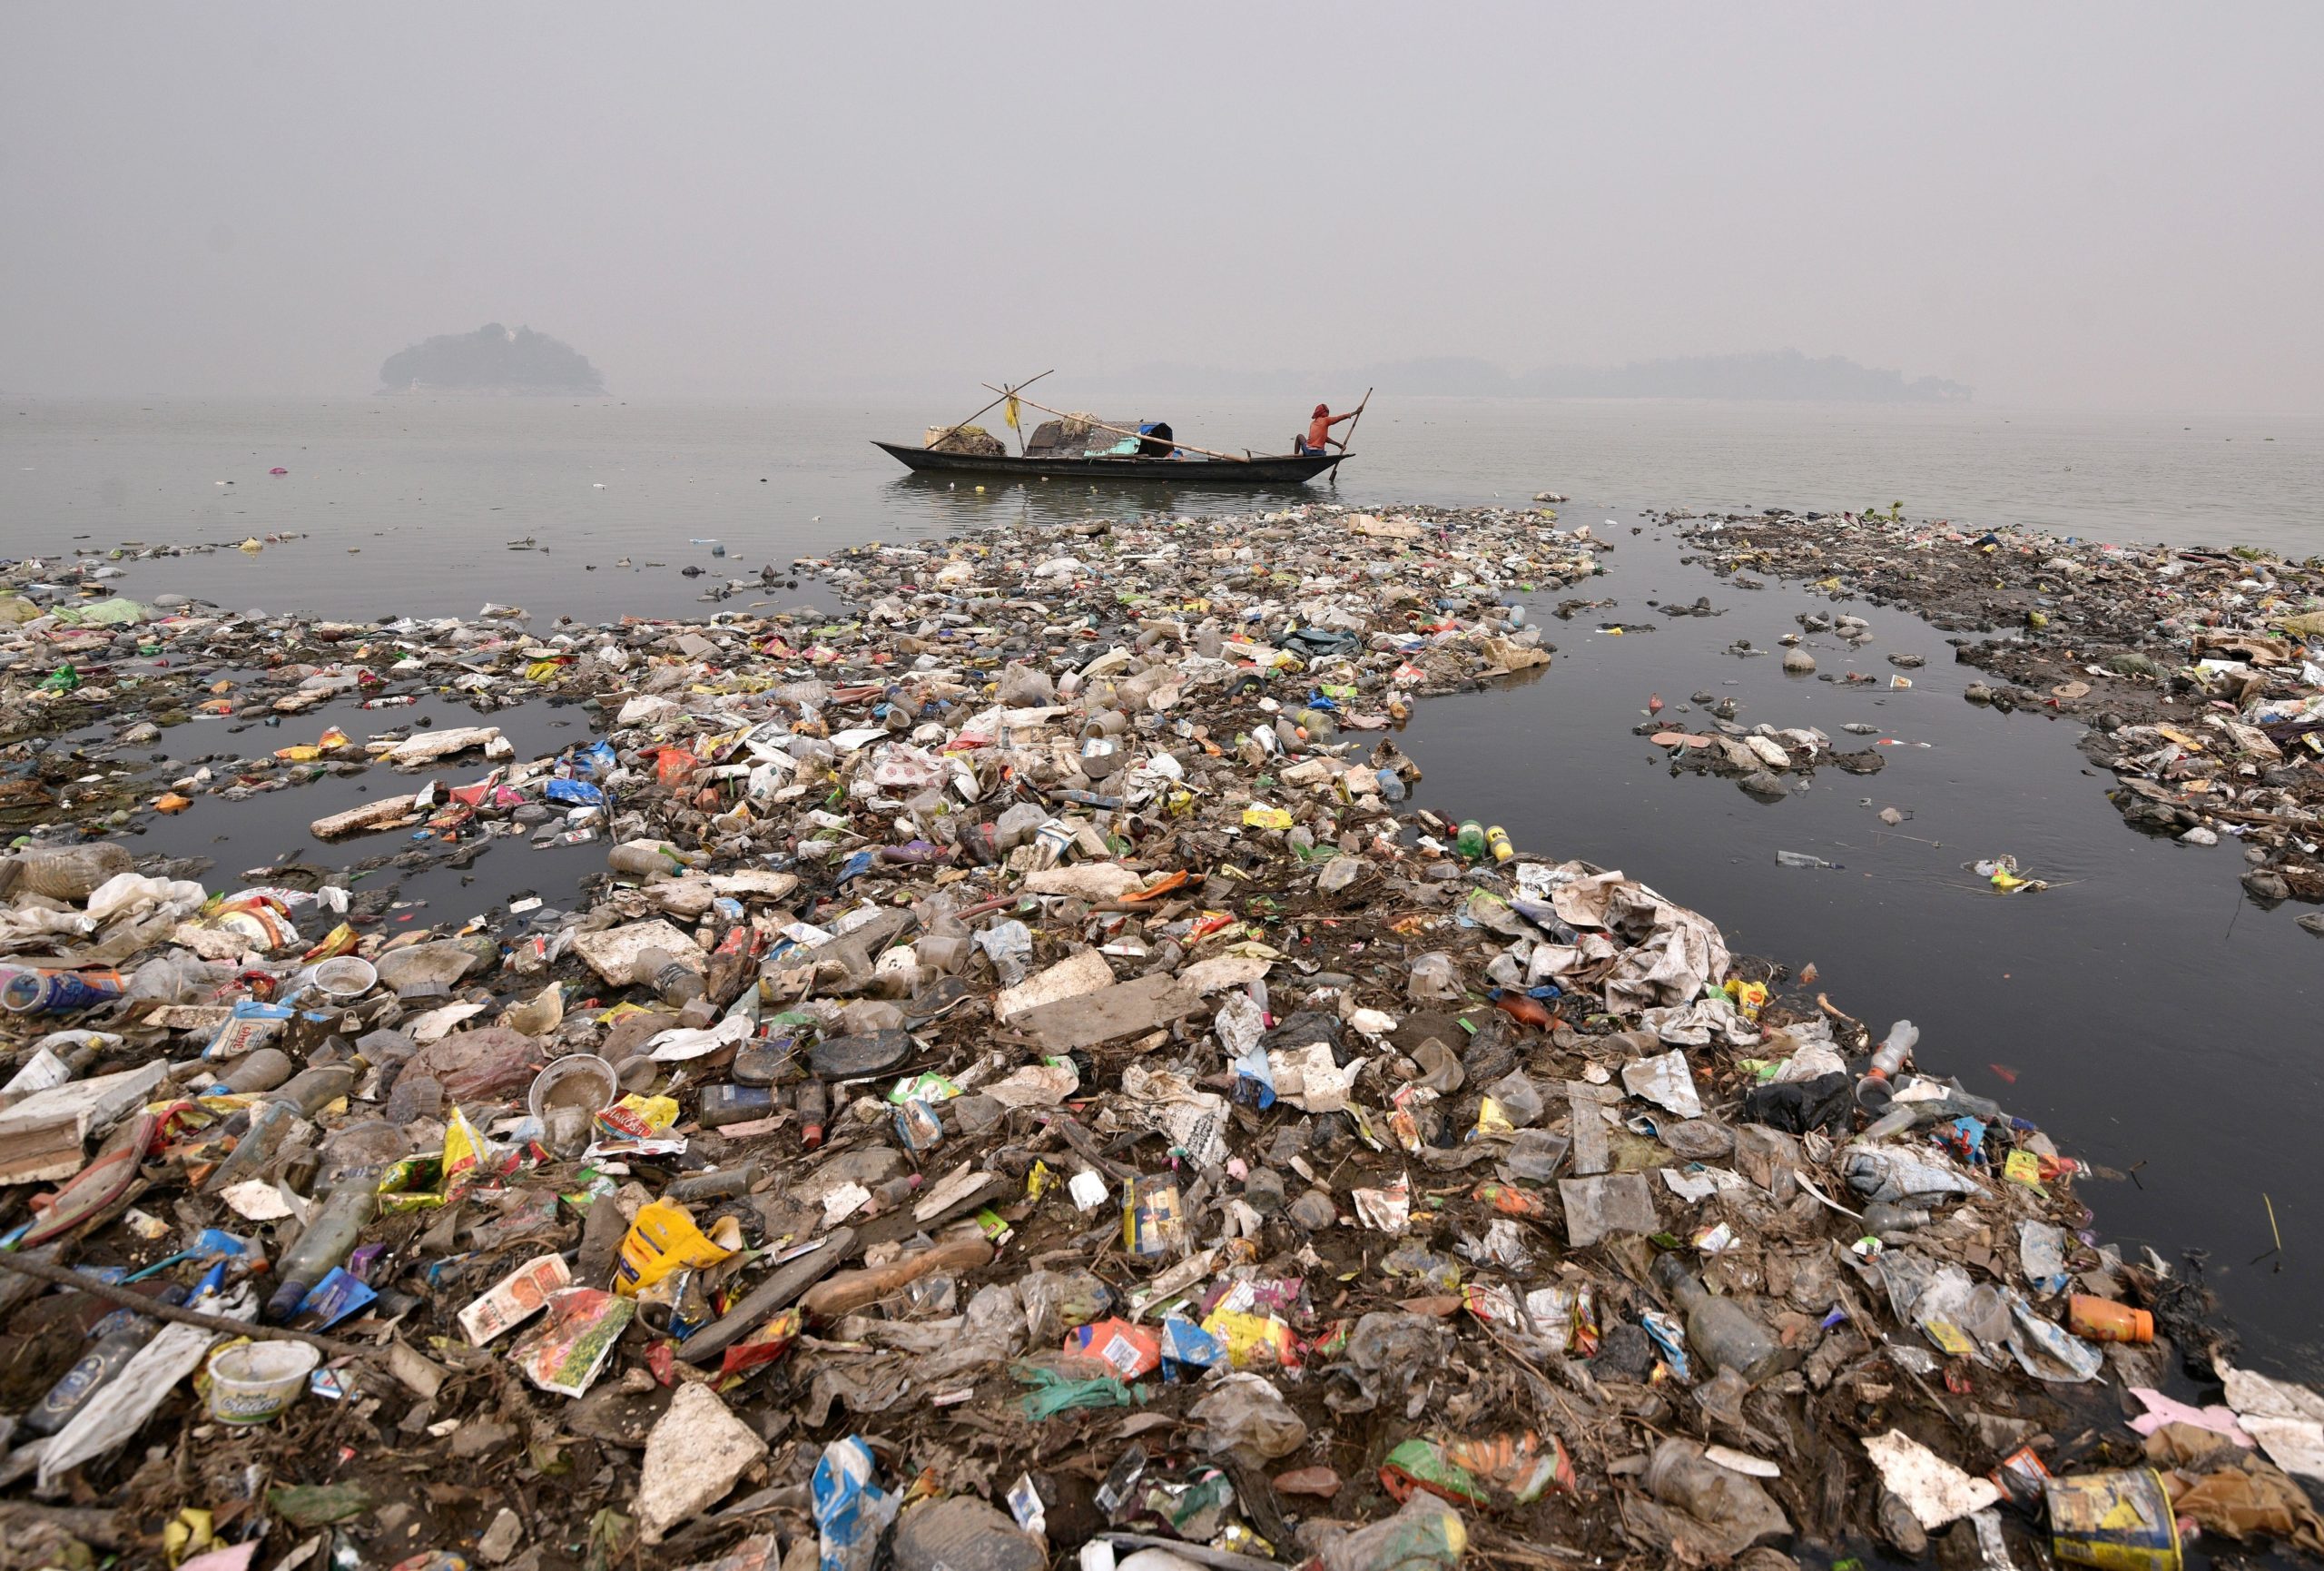
Land Dumping
Runoff and solid waste degrade river clarity and water quality.